
Given the following processes with their times and priority (lower number indicates higher priority)
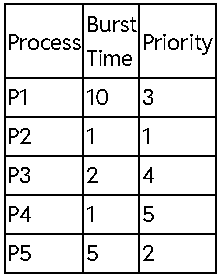
Which of the following is a value of average waiting time using priority scheduling algorithm?
Pick an option to check yourself, or open the answer below.
Show answer & explanation
Correct answer: D. 8.2
Explanation
All arrive at 0. Order by priority: P2 (0–1), P5 (1–6), P1 (6–16), P3 (16–18), P4 (18–19). Waiting = 0 + 1 + 6 + 16 + 18 = 41; average 41/5 = 8.2.
More System Software and Operating System questions
- Calculate the average response time for these processes with nonpreemptive priority Scheduling algorithm? Priority of the process are as fo…
- Match List - I with List - II. (D) Priority Scheduling (IV) Select the process for execution with smallest next Burst time.
- Match List - I with List - II.
- What is the significance of the Banker's algorithm in terms of resource management?
- The order of steps of Address Translation in Linux Virtual Memory Scheme will be : A. register B. offset C. Page directory. D. Page table E…
- Match List-I with List-II :